Uzbekistan Sees Robust Trade Growth, Defying Global Slowdown
Uzbekistan’s foreign trade turnover (FTT) reached $51.4 billion in the January-August 2025 period, up 19.8 period or $8.49 billion compared to the same period last year.
Exports Show Strong Growth, But Trade Deficit Remains
Exports continued to outpace imports in terms of growth rate, totaling $22.98 billion-an increase of 31.3 per cent year-on-year, The Caspian Post reports via Uzbek media.
However, imports also rose to $28.45 billion, up 11.8 per cent, resulting in a trade deficit of $5.47 billion.
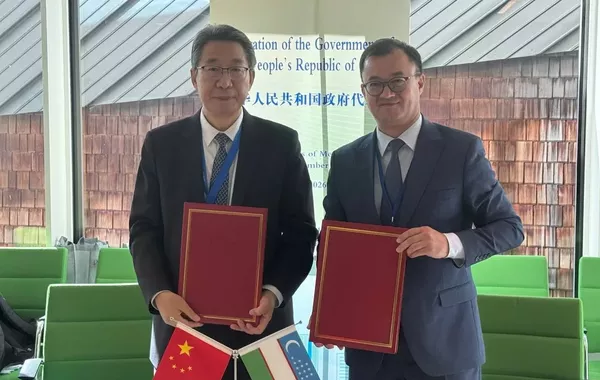
Trade with 200 Countries Led by China and Russia
Uzbekistan expanded its trade relationships with 200 countries, with the top trading partners accounting for a significant share of turnover:
China - 18.9 per cent
Russia - 16.1 per cent
Kazakhstan - 5.9 per cent
Türkiye - 3.7 per cent
Republic of Korea - 2.2 per cent
Export Composition: Manufactured Goods, Agriculture, and Services
Goods made up 75.2 per cent of Uzbekistan’s total exports. Key categories included:
Manufactured goods - 11.1 per cent
Food and live animals - 7.8 per cent
Chemicals - 5.9 per cent
Mineral fuels and lubricants - 4.4 per cent
Top export destinations were Russia (12.5 per cent), China (5.4 per cent), Kazakhstan (4.0 per cent), Afghanistan (3.8 per cent), Türkiye (3.2 per cent), France (2.7 per cent), UAE (2.1 per cent), and Kyrgyzstan (1.6 per cent).
Agricultural Exports See Notable Rise
Exports of fruits and vegetables reached 1.46 million tons, a 7.3 per cent year-on-year increase. The value of these exports surged by 37.3 per cent, totaling $1.27 billion and representing 5.5 per cent of overall exports.
Textile Exports Dip
In contrast, textile exports dropped 17.0 per cent from the previous year, amounting to $1.67 billion or 7.3 per cent of total exports. Finished textile products made up 50 per cent of this figure, while yarn accounted for 30 per cent.
Services Exports Climb Nearly 29 per cent
Service exports posted strong growth, totaling $5.71 billion, or 24.8 per cent of total exports, a 28.6 per cent increase year-on-year. Leading segments included:
Travel and tourism - 53.6 per cent
Transport services - 32.0 per cent
Telecommunications and IT - 7.9 per cent
Other business services - 2.6 per cent
Imports Driven by Machinery, Chemicals
On the import side, goods accounted for $25.53 billion, while service imports totaled $2.92 billion. The main imported goods categories were:
Machinery and transport equipment - 33.8 per cent
Manufactured goods - 16.1 per cent
Chemicals - 12.6 per cent
Imports originated from 170 countries, with the largest shares coming from:
China - 29.7 per cent
Russia - 19.1 per cent
Kazakhstan - 7.4 per cent
Türkiye - 4.1 per cent
Republic of Korea - 3.9 per cent
Germany - 2.7 per cent
India - 2.6 per cent
Service Imports Rise in Line with Global Trends
Service imports rose 28.6 per cent year-on-year, matching the pace of service exports. The sectoral breakdown included:
Travel - 56.8 per cent
Transport - 18.0 per cent
Telecom and IT services - 9.7 per cent
Other business services - 5.4 per cent